


When planning your permaculture oasis, there are few planning tools as powerful as GIS. What is GIS you ask?
GIS, or Geographic Information Systems, is a fancy way to say playing with maps on your computer. For us, it is taking imagery and map information to better understand a piece of land. There are numerous computer software out there, but GoogleEarth is a great place (and free) to start. Once you have experience with that, you can move on to programs like QGIS, ArcGIS and Erdas Imagine, which all give greater analytical power.
Do not be intimidated! This may seem daunting. But you can use simple tools with GoogleEarth to get started in conducting your own site planning. There are loads of tutorials out there that will make you a pro in no time.
We have all seen sites planned out with a GoogleEarth image. It is an extremely quick and powerful way to see your vision of the place. I like to think of it as seeing what the crow (or macaw or goose or whatever you have) sees as it flies overhead.

Where else are you going to get a view from a kilometer or two in the air without a drone, helicopter, or crop duster? We can thank the space race for our wonderful satellite imagery.
Aerial pictures of your land are useful in and of themselves, but you can do so, so much more. One can accurately measure the dimensions, slopes, azimuths, contour lines, floodplains, viewsheds, solar exposure, and much more. Part of the power of GIS is being able to tap into the vast geographic and agricultural information that are accessible online, and perform some impressive analyses. For example, hardiness zones (USDA or UK), average annual precipitation, topography, soil types, average soil moisture, and vegetation types are all within your grasp once you can use GIS.
These are great things to know as a Permaculture community.
But for now, GoogleEarth is fine for our purposes.
You may be asking yourself, is it worth it?
A hand illustrated map is no-doubt beautiful, and reflects your vision for the design, it is inherently abstract. It can serve as a vision alongside your GIS map.
Let’s build on what the crow sees. Here is a quick example to show what you can do in under an hour. It is a potential Permaculture site in Oregon County, Missouri, USA:
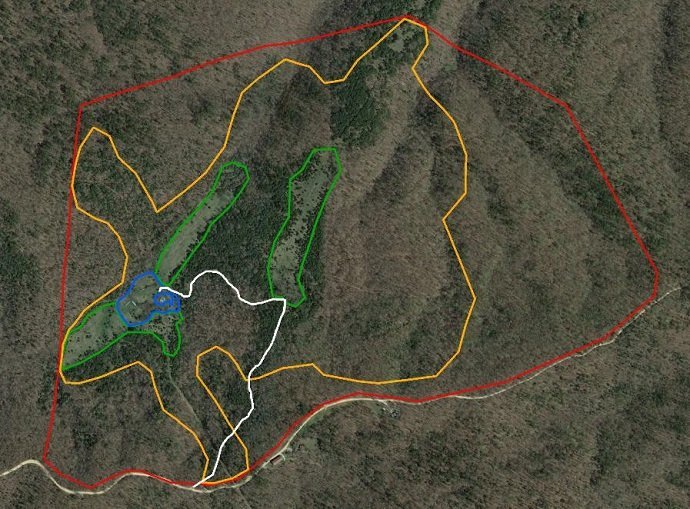
Above we see Zones 1 and 2 in Blue, Zone 3 in Green, Zone 4 in Orange, and property boundary containing Zone 5 in Red. The driveway to the house is in white.
This is a useful visualization of the zones on top of 2015 autumn imagery (yes, we can choose what time of year our imagery is from). But another quick trick we can use is looking at the topographic layout of our property.
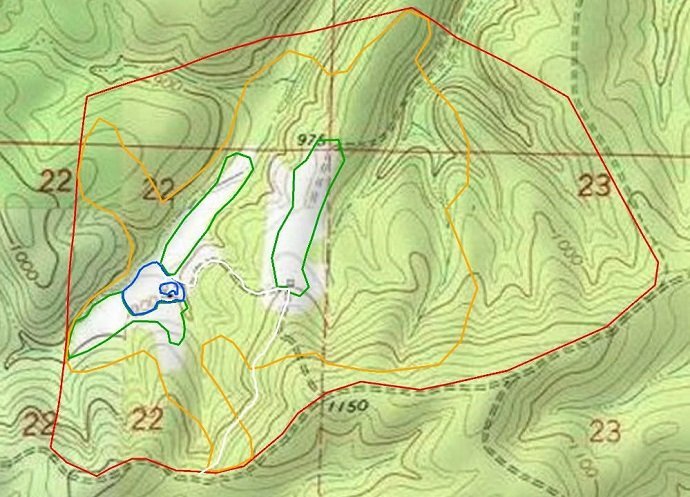
If you do not know how to read a topographic map, it can be a great help for understanding a landscape.
Above, clear to the trained eye, is great potential for gentle-slope cultivation in zones 1,2, and 3. Sometimes these maps reveal slope changes that can be hard to notice with your feet in the mud, believe it or not. Here, zones 4 and 5 contain much greater elevation changes, which is good. Working smarter not harder whenever possible is the name of the game. Leaving zones 4 and 5 with the ‘scenic’ climbs is a great approach, and can be planned without investigating every single spot.
The two main drainages running from bottom left to top right (to the Northeast in this case) are easy to read from the topo lines here and would affect the flow of water through the property. I don’t need to tell you this is essential information. It is also something you would probably know after a single visit to the site, but is very useful to see in scale relative to your zoning areas.
These maps were done in under an hour, to show you that GIS is a great tool for any person planning permaculture.
I hope this has been insightful for how GIS can play a part in your Permaculture planning!
You can do it!
Happy Foraging


Great article thanks for sharing. Google topo maps are always useful, even just hiking.
In addition to GIS software you list many state DEP’s have their own GIS website, like NJ GeoWeb for example. You can overlay historical maps plus all of the environmental data the NJ DEP ever collected.
Google Earth images don’t come with the red property line drawn for you; this doesn’t explain where you’d get that information or the topographic map. That would be useful.
I just wrote in our blog how I used Google Earth and an image editing program. Link is here:
https://starvingartists-homestead.blogspot.com/2017/04/google-earth-as-permaculture-tool.html
I have been using mapit his on my android phone. It’s affordable and the first pretty good gis program. It’s affordable and can export data to other programs like Google maps etc. I use it when laser leveling swales and around zones, gardens, and gardens.
https://play.google.com/store/apps/details?id=com.osedok.gisdatacollector